
Chart patterns are known as price patterns. In the stock market, every pattern gets repeated which helps us to know the market direction will it go up or down.
No chart pattern can guarantee us profits. The pattern just represents the probability. It is stated that history repeats itself, that’s why the price is predicted based on the movement of the chart.
A pattern is a shape that emerges on a price chart and predicts the price’s future behaviour. It is a kind of technical analysis used by traders to identify opportunities for investment.
We get to know from the chart pattern whether the price will rise or fall now. This makes it easier for us to take trades. If we are doing intraday trading then we can take our position by knowing the market trend from the chart.
types of chart patterns
There are three main types of chart patterns.
- Reversal Chart Pattern
- Continuation Chart Pattern
- Bilateral Chart Pattern
1.Reversal Chart Pattern
Reversal chart pattern helps to reverse the trend of market .
If the market is in uptrend and a reversal pattern forms, then uptrend will reverse and move into a downtrend.
If the market is in downtrend a reversal pattern forms, then downtrend will reverse and move into uptrend.
Here, we are going to cover six important reversal patterns.
- Double Top
- Double Bottom
- Head and Shoulder
- Inverse Head and Shoulder
- Rising Wedge
- Falling Wedge
Double Top
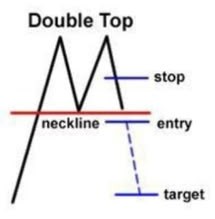
A double top is a highly bearish pattern formed when an asset reaches a high price twice in a row, followed by a moderate decrease between the two highs. It is verified when the asset’s price falls below a support level equal to the low of the two previous highs.The twice touched top resemble a strong resistance.
Double Bottom

A double bottom pattern is a famous bullish technical pattern that indicates a significant shift in trend and a momentum reversal from a previous downward move in market trading. The double bottom resembles the letter “W.” The twice-touched bottom is now seen as a strong support level.
It predict bearish to bullish trend reversal.
Head and Shoulder

Head and shoulder is a strong reversible pattern.it forms a structure like head and shoulders. It is a bearish pattern.Head and shoulder pattern formed with three peaks .Two side peaks are small in hight but the middle one is highest.
It predict bullish to bearish trend reversal.
Inverse Head and Shoulder
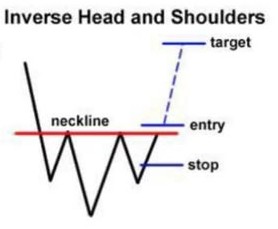
Inverse head and shoulder is a strong reversible pattern. It forms a structure like reverse of head and shoulder pattern.It works opposite to the head and shoulders chart pattern.
it predict bearish to bullish trend reversal.
Rising Wedge
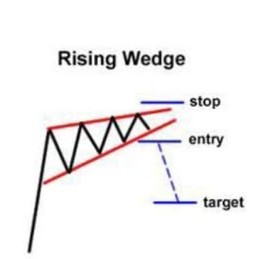
The rising wedge is mostly considered a reversible pattern. If an uptrend is going on and a rising wedge is formed in it, then it shows probability of a bearish reversal means price is going to fall.
Falling Wedge

The falling Wedge pattern is mostly considered as a reversible pattern.when falling Wedge appear after downtrend then it shows the probability of bullish reversal means price is going to rise.
2.Continuation Chart Pattern
The continuation chart does not make any difference to the market trend. The direction in which the market is moving does not make any difference to the trend even after the continuation chart pattern is formed.
The continuation pattern shows that the stock market will continue in the same trend in which it is currently moving.
Here, we are going to cover six important continuation chart patterns.
- Bullish Rectangle
- Bearish Rectangle
- Bullish Pennant
- Bearish Pennant
- Falling Wedge
- Rising Wedge
Bullish Rectangle
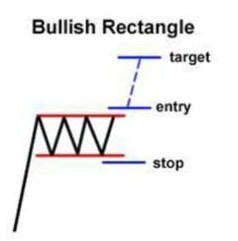
A bullish rectangle is a pattern that emerges when the market consolidates during an uptrend and is described by support and resistance lines.
Bearish Rectangle
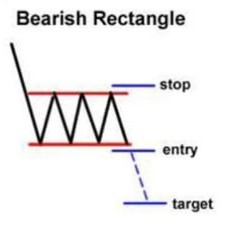
A bearish Rectangle is a pattern that emerges when the market consolidates during a downtrend.it is a continuation pattern.
Bullish Pennant
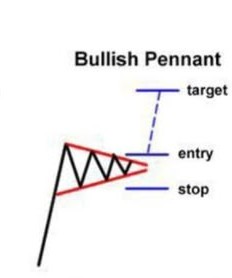
Bullish Pennant is a continuation pattern. It forms when a huge amount of movement occurs during uptrend, also known as the flagpole. The flagpole is then followed by a consolidation period with converging trend lines—the pennant—and a breakout movement in the same direction as the original huge movement, which marks the second half of the flagpole.
Bearish Pennant
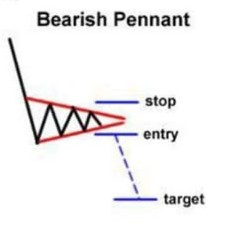
Bearish Pennant is a continuation pattern. It forms when a huge amount of movement occurs during downtrend, also known as the flagpole. The flagpole is then followed by a consolidation period with converging trend lines—the pennant—and a breakout movement in the same direction as the original huge movement, which marks the second half of the flagpole.
Rising Wedge

When rising Wedge is formed whithin downtrend,it indicates continuation of downtrend.
Falling Wedge
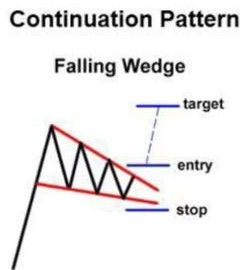
When falling Wedge is formed whithin uptrend,it indicates continuation of uptrend.
3.Bilateral Chart Pattern
Bilateral patterns are a bit trickier. They indicate that the price can move in any direction. This pattern has a triangle formation. No direction of this pattern is fixed, it can take a breakout in any direction.
There are three bilateral triangle pattern.
- Symmetrical Triangle
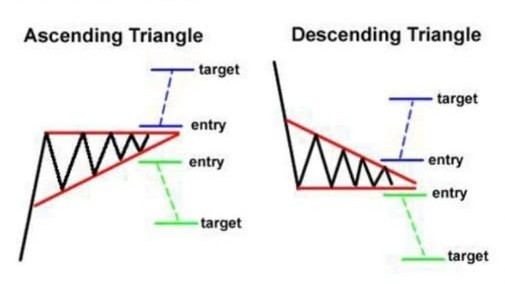
- Ascending Triangle
- Descending Triangle

why do we need chart pattern
There are many reason that shows us that how chart pattern are usefull to us.
They provide a visual picture of how prices have changed over time, allowing traders to identify trends, reversals, and continuations.
They assist to recognize essential price levels where supply and demand will likely intersect, possibly acting as support or resistance to future price movements.
They can disclose market their overall moods, including emotions such as fear, greed, and indecision, which can influence price movements.
They can be used as part of a comprehensive trading strategy to assist identify entry and exit points, set price goals, and manage risk.
Understanding the patterns and their potential implications allows traders to make more informed judgments about whether to enter or quit a transaction, perhaps leading to higher profits and risk management.
Chart patterns are very beneficial for day traders since they allow them to swiftly identify probable breakout and reversal points.
If you want to know online earning ways then click here.
Good it helped me a lot